0345 363 1130
 info@xchangetraining.co.uk


Microsoft Excel – Formatting Database Lists as Tables
Although Excel is not the best place to develop a sophisticated relational database it can be an ideal product for a one-off list. Once laid out in a continuous area, as shown in figure 1, with field headings at the top and records laid out sequentially under these the options on the Data ribbon, as shown in figure 2, e.g. Sort and Filter can be used to change the order and query the database list.
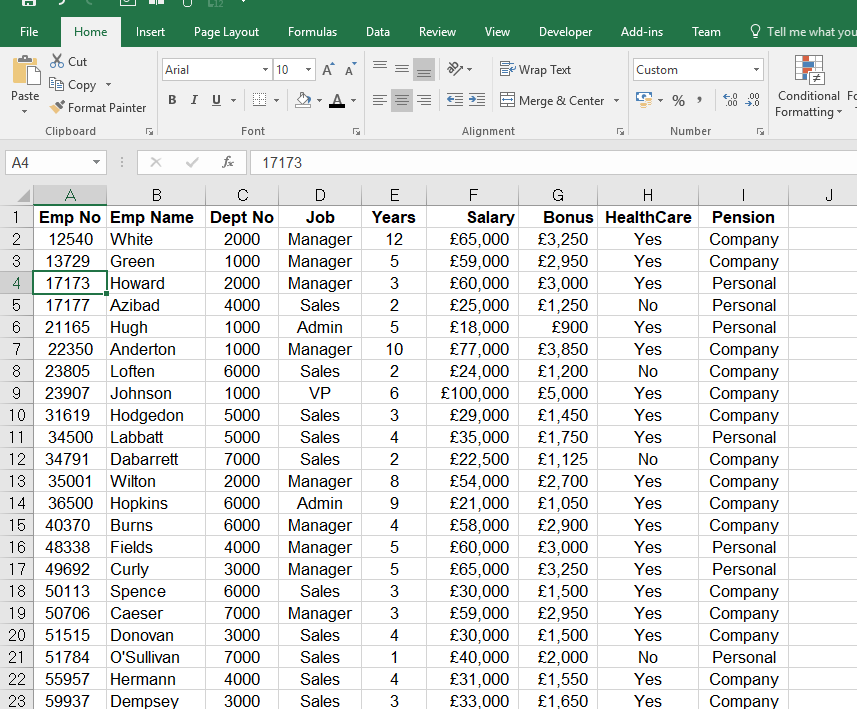
Figure 1 – Laying out a database list
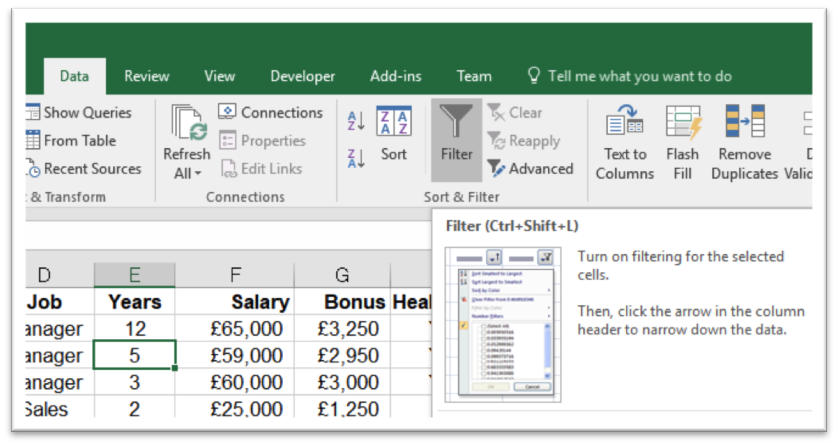
Figure 2 – Filtering from the data ribbon
A more flexible choice, in my opinion, is to format the database list as a table. The table option can be applied to an existing database as shown in figure 1 or chosen before record and field entry. The advantages and extra functionality are the ability to create totals, insert calculations quickly for each record and more straightforward data entry.
The Steps to Formatting a List as a Table
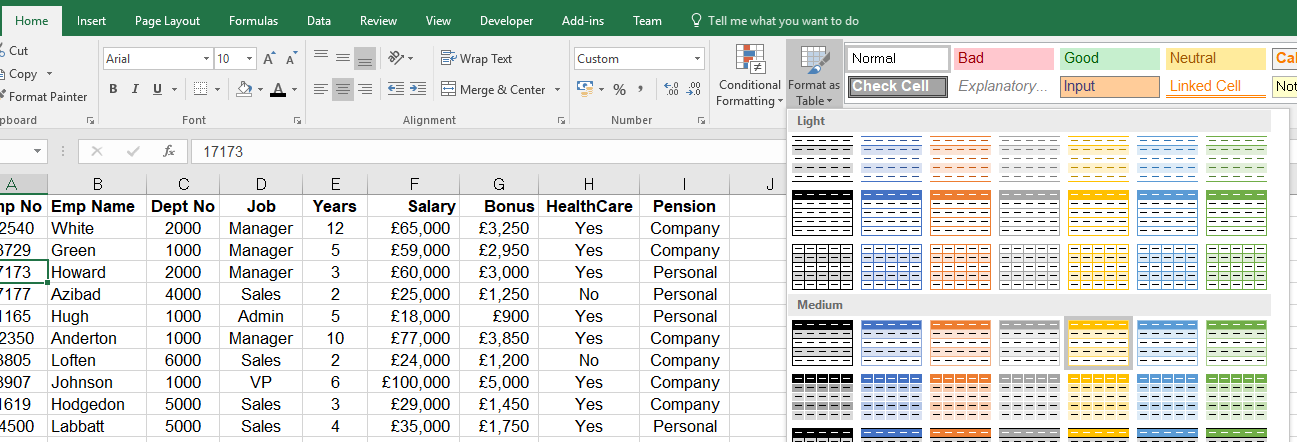
Figure 3 – Formatting a table
- Set the active cell to a cell anywhere inside the database list.
- Choose a table style, as shown in figure 3.
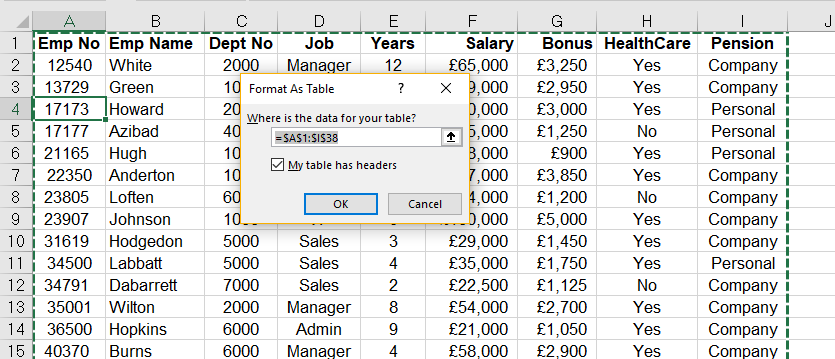
Figure 4 – Specifying a data range
- Check the range selected includes all records and field headings and click on OK.
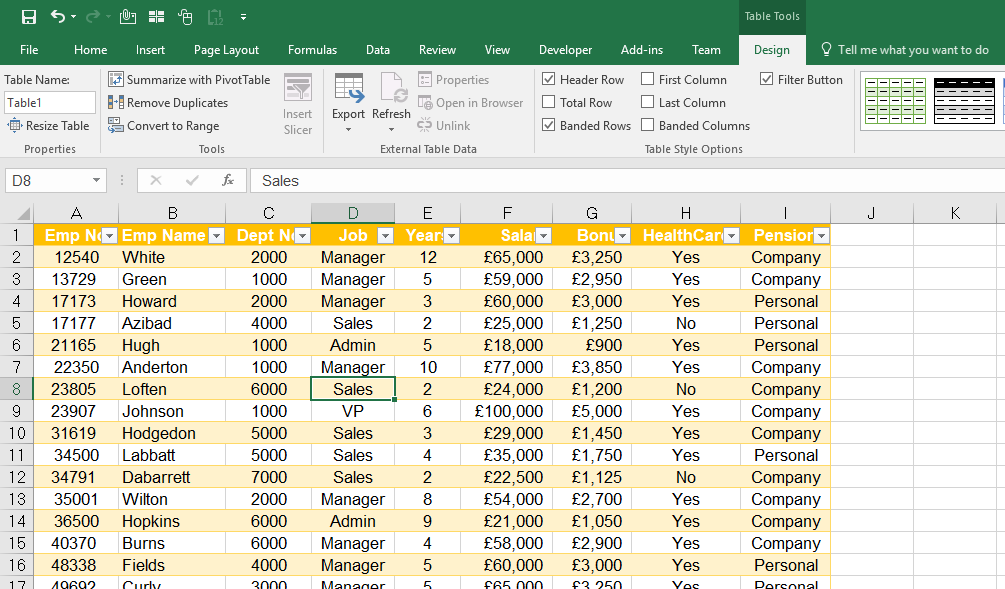
Figure 5 – Formatted table
- When formatted as a table a new ribbon appears under Design in Table Tools.
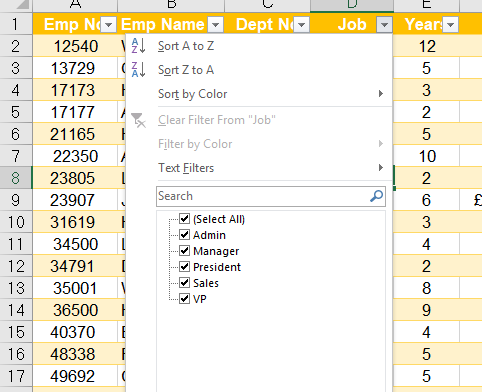
Figure 6 – Sorting and filtering
Sorting and filtering arrows, as shown in figure 6, appear next to the field headings similarly to choosing Autofilter on the Data tab.
Adding or Amending Records
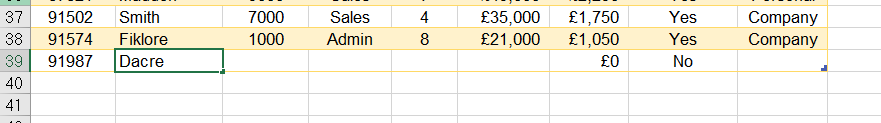
Figure 7 – Adding a new record
As shown in figure 7 when adding a record the new information becomes part of the table. Each table is named, and the name is at the beginning of the Design tab as shown in figure 5.
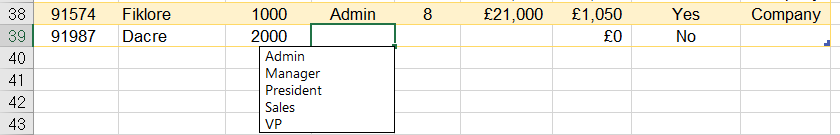
Figure 8 – Choosing from list
An additional shortcut, as shown in figure 8, when entering data is to use the [ALT] key and ê (down arrow) on the keyboard to bring up a unique list of any information entered in this field.

Figure 9 – Added record
Adding a record means it becomes part of a table as shown in figure 9.
Creating Fields and Calculations
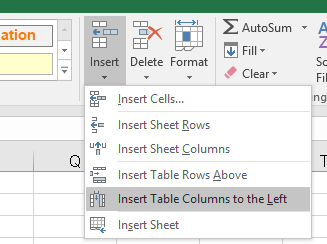
Figure 10 – Inserting table columns
- Once a table is formatted the Insert option on the Home tab, shown in figure 10, shows extra functionality,g. to add table rows or columns.
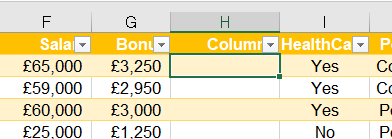
Figure 11 – Inserted column
- Inserting a column creates a new column with a header of “Column” this can be amended to a new field name as shown in figures 11 and 12.
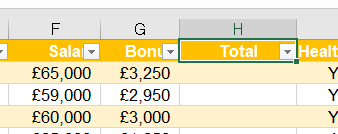
Figure 12 – Total column
- A calculation can be created to add the salary and bonus together, as shown in figure 13, to give a total for each person. Notice that the formula references each column as a field.
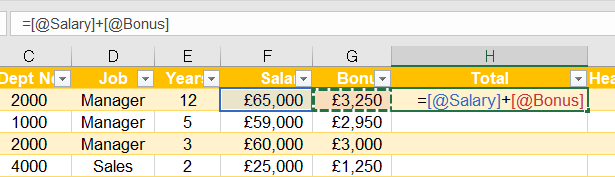
Figure 13 – Calculation in a table
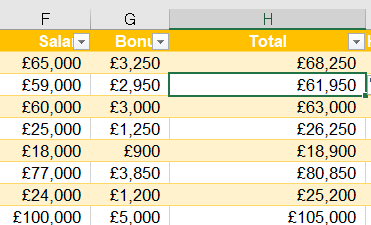
Figure 14 – Completed calculated field
- The main benefit is that the formula is copied down the whole column to the last record in the list after pressing [ENTER] as shown in figure 14.
Adding a Total Row
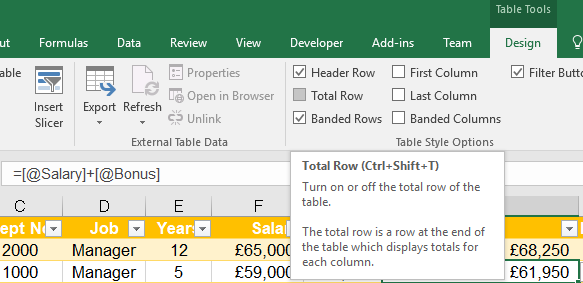
Figure 15 – Total row
- The total row option is available on the Design tab in the Table Style Options group.
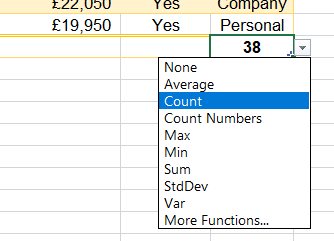
Figure 16 – Total row calculation options
- A total row appears at the bottom of the list, and the final field in the database has a calculation added, see figure 16, depending on the data type of the field,g. count for textual information and sum for numeric values.
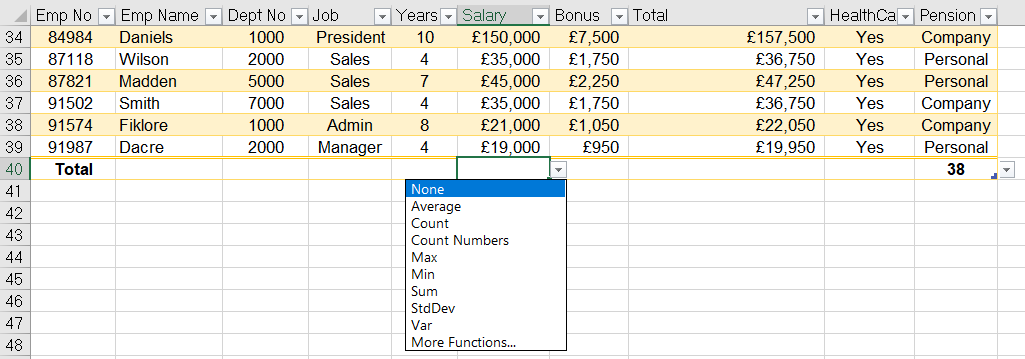
Figure 17 – Total row addition of a new calculation
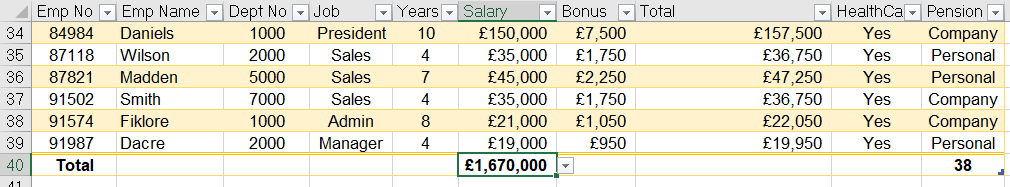
Figure 18 – Total on salary
- The total row can be used to add a new calculation at the bottom of any field in the database list as shown in figures 17 and 18.
When filtering the total row calculations will reflect the criteria chosen as shown in figures 19 and 20.
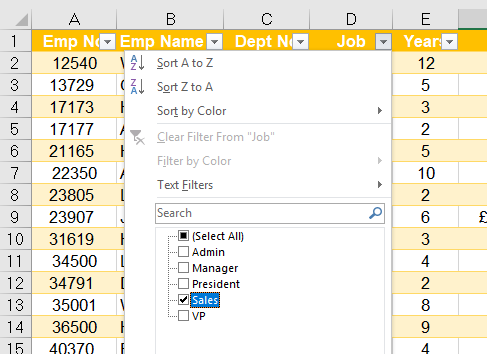
Figure 19 – Filtering by Sales
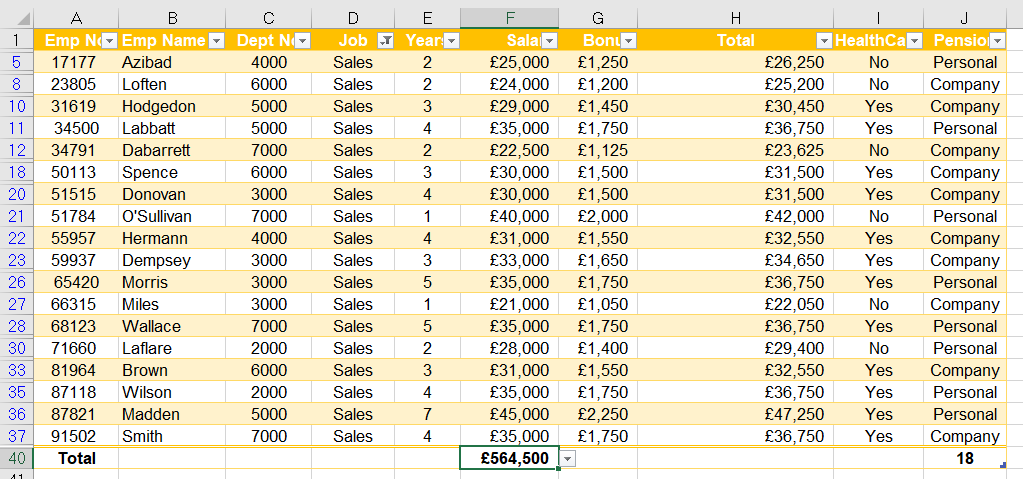
Figure 20 – Salary total after filtering by Sales